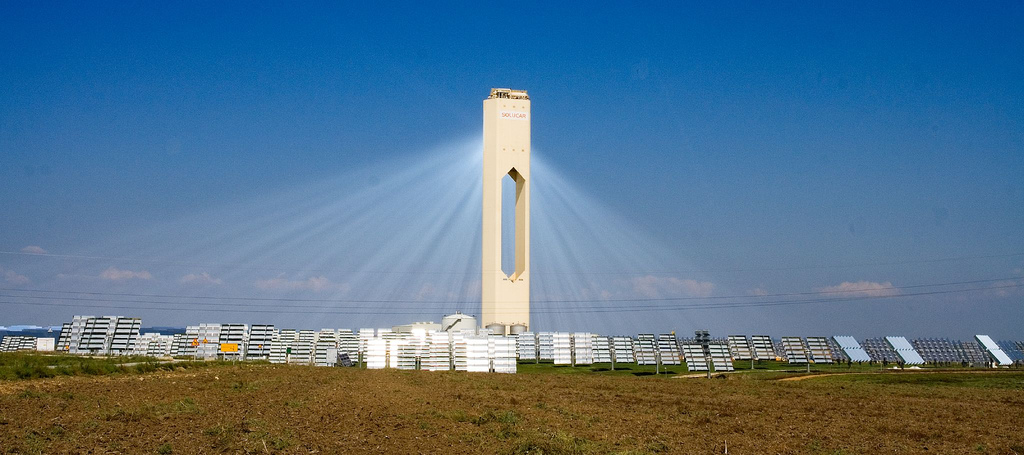
The global solar energy sector experienced significant growth in 2024 and 2025, marked by record capacity additions and decreasing costs. This surge made solar power an increasingly appealing option for homeowners and small businesses worldwide, rapidly changing the global energy landscape.
What Drove the Global Solar Energy Boom in 2024-2025?
The period of 2024-2025 saw remarkable expansion in solar photovoltaic (PV) capacity. In 2024, a record 602 GW of solar PV capacity was added globally, representing a 32% increase from the previous year. This pushed the total installed solar PV capacity worldwide past the 2-terawatt (TW) milestone by the end of 2024, nearly doubling the capacity from 2022. By early 2026, the global solar fleet had surpassed 3 TW.
Growth continued into 2025, with global solar additions estimated to be between 511 GW and approximately 690 GW, depending on the reporting agency. This substantial increase was fueled by several key factors:
- Record-Low Module Prices: An oversupply in the market led to significantly reduced prices for solar modules, making installations more affordable.
- Favorable Policy Environments: Many regions implemented policies that supported solar deployment, encouraging both utility-scale and distributed systems.
- Falling Installation Costs: Beyond module prices, the overall cost of installing solar systems continued to decline, enhancing economic viability for consumers.
China remained a dominant force, accounting for approximately 60% of new global additions in 2024, installing 357 GW. Other significant contributors included the United States (8% of global additions in 2024) and India (5%). Emerging markets also saw a sharp rise in activity, with Pakistan, for example, responsible for 3% of global PV capacity additions in 2024, driven by low solar PV prices and high electricity tariffs. In 2025, China added between 315.1 GW and 415 GW, while India added between 37 GW and 54 GW, and the European Union added between 67.2 GW and 70 GW, according to various reports.
How Did Solar Energy Costs Change?
A major catalyst for the global solar energy boom was the continued reduction in costs. Record-low prices for solar modules, largely due to an oversupply, played a critical role in making solar power more accessible and competitive. This trend of falling costs, combined with decreasing installation expenses, significantly improved the economic case for adopting solar energy for both residential and commercial applications.
While specific costs can vary widely by region, system size, and installation complexity, the overall global trend has been towards greater affordability. This has allowed more homeowners and small businesses to invest in solar solutions, potentially reducing their electricity bills and contributing to a cleaner energy future. When considering a solar installation, it is always advisable to consult with a qualified installer to get accurate cost estimates and understand the potential savings for your specific situation.
Solar's Growing Role in Global Electricity Generation
The impact of this growth is clearly visible in global electricity generation. In 2024, solar PV generated over 2,100 TWh of electricity globally, representing 6.9% of total generation, up from 5.6% in 2023. This increase of approximately 480 TWh between 2023 and 2024 was more than 2.5 times larger than that of any other source.
Solar's rising prominence led to significant milestones in various regions. In the European Union, solar PV generation surpassed coal for the first time in 2024, with solar alone contributing around 14% of total EU electricity generation. Similarly, in the United States, the combined share of solar PV and wind in total generation reached 16%, overtaking coal for the first time.
By the end of 2025, solar PV had the largest installed capacity of any power technology globally. However, this rapid expansion also highlights the need for improved and more flexible grid infrastructure to integrate the increasing amount of solar power effectively. Some regions, such as Chile and Cyprus, experienced curtailment of solar PV output in 2024 due to grid limitations, underscoring the growing importance of battery storage solutions to minimize waste and enhance grid stability.
For homeowners and small businesses considering solar, it's important to research local incentives and net metering policies, as these can change. Always confirm current rules with your relevant government agencies or utility providers. Engaging a qualified installer is crucial for a safe and efficient solar energy system.